

Observability
Zilla Console surfaces the operational state of everything it manages directly on the Dashboard, without a separate monitoring tool: how healthy your Kafka clusters are, how your published APIs are performing, and where governance rules are being violated.
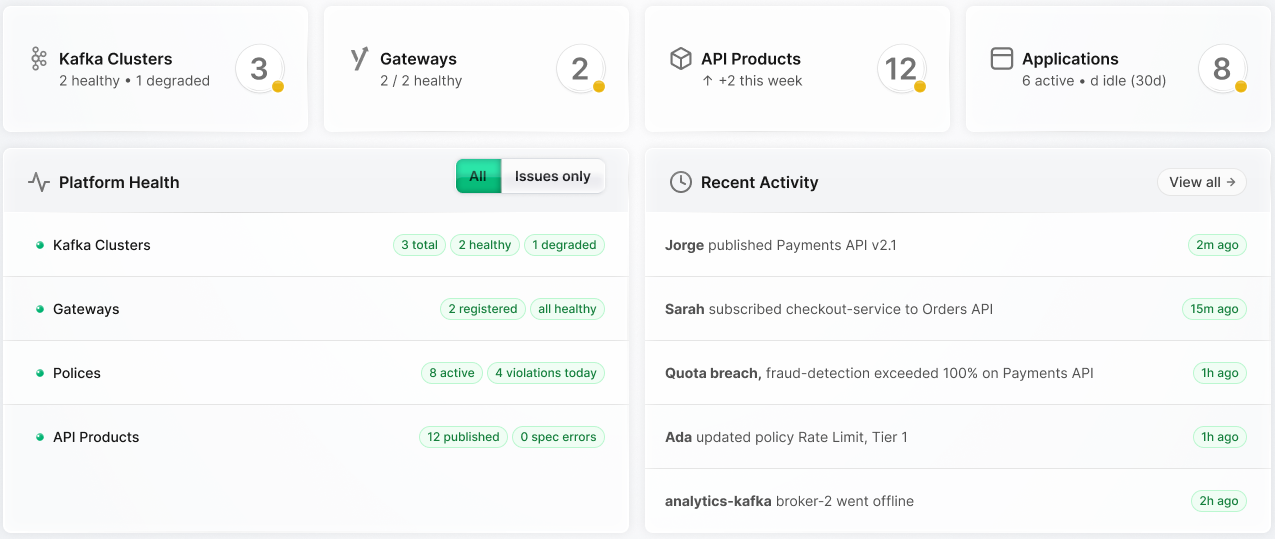
What's on the Dashboard
- Stream Ops shows cluster health, throughput, and consumer lag across every attached Kafka cluster.
- API Analytics shows traffic, latency, and error rate for the APIs served by your Gateways.
- Governance shows policy violations against the rules defined under Policies.
A Platform Health panel and Recent Activity feed sit above these sections, giving a one-glance summary of Kafka Clusters, Gateways, API Products, and Applications, and a running log of who changed what. A row of action cards at the top of the Dashboard — Review Alerts, Audit Changes, Approve Requests, and Manage Users — jumps straight to the Inbox, Audit Log, pending subscription approvals, and Access.
Next Steps
- Stream Ops covers monitoring cluster health, throughput, and consumer lag.
- API Analytics covers monitoring traffic, latency, and errors for deployed API Products.
- Governance covers monitoring policy violations.